Debugging & Logging
For every deployment of your Pages project, you can access the logs of your Functions using the Cloudflare dashboard or the wrangler CLI.
Logs are a powerful debugging tool that can help you test and monitor the behavior of your Pages Functions once they have been deployed.
Logs can capture various things, such as:
- Successful or failed requests to your Functions
- Uncaught exceptions thrown by your Functions
- Custom
console.logs declared within your Functions
while at the same time, providing detailed information about the events themselves.
You can start a logging session either by running wrangler pages deployment tail in your terminal, or from your Cloudflare dashboard through Account Home > Pages > your Pages project > Deployment Details > Functions Tab.
Adding custom logs
Custom logs are console.log() statements that you can add yourself inside your Functions. When streaming logs for deployments that ??contain/reference?? these Functions, the statements will appear in both wrangler pages deployment tail and dashboard outputs.
Here is an example of a custom console.log statement inside a Pages Function:
export async function onRequest(context) {  const { request }  = context;  console.log(`[LOGGING FROM /hello]: Request came from ${request.url}`);
  return new Response("Hello, world!");
}
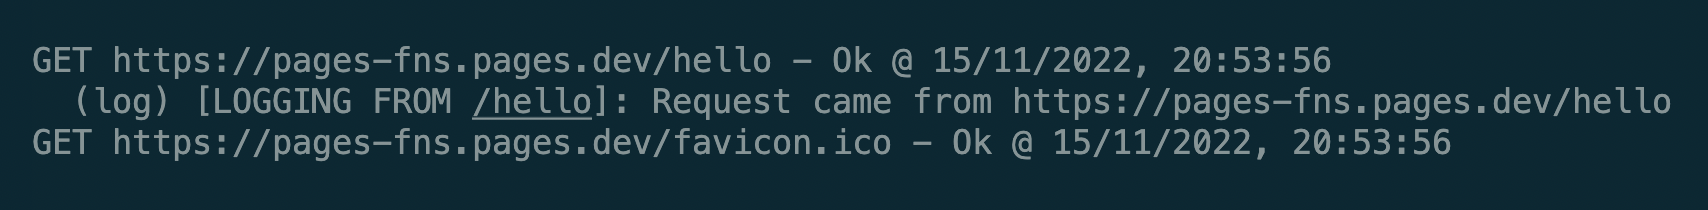
After you deploy the code above, run wrangler pages deployment tail in your terminal, and then access the route at which your Function lives. Your terminal should will display:
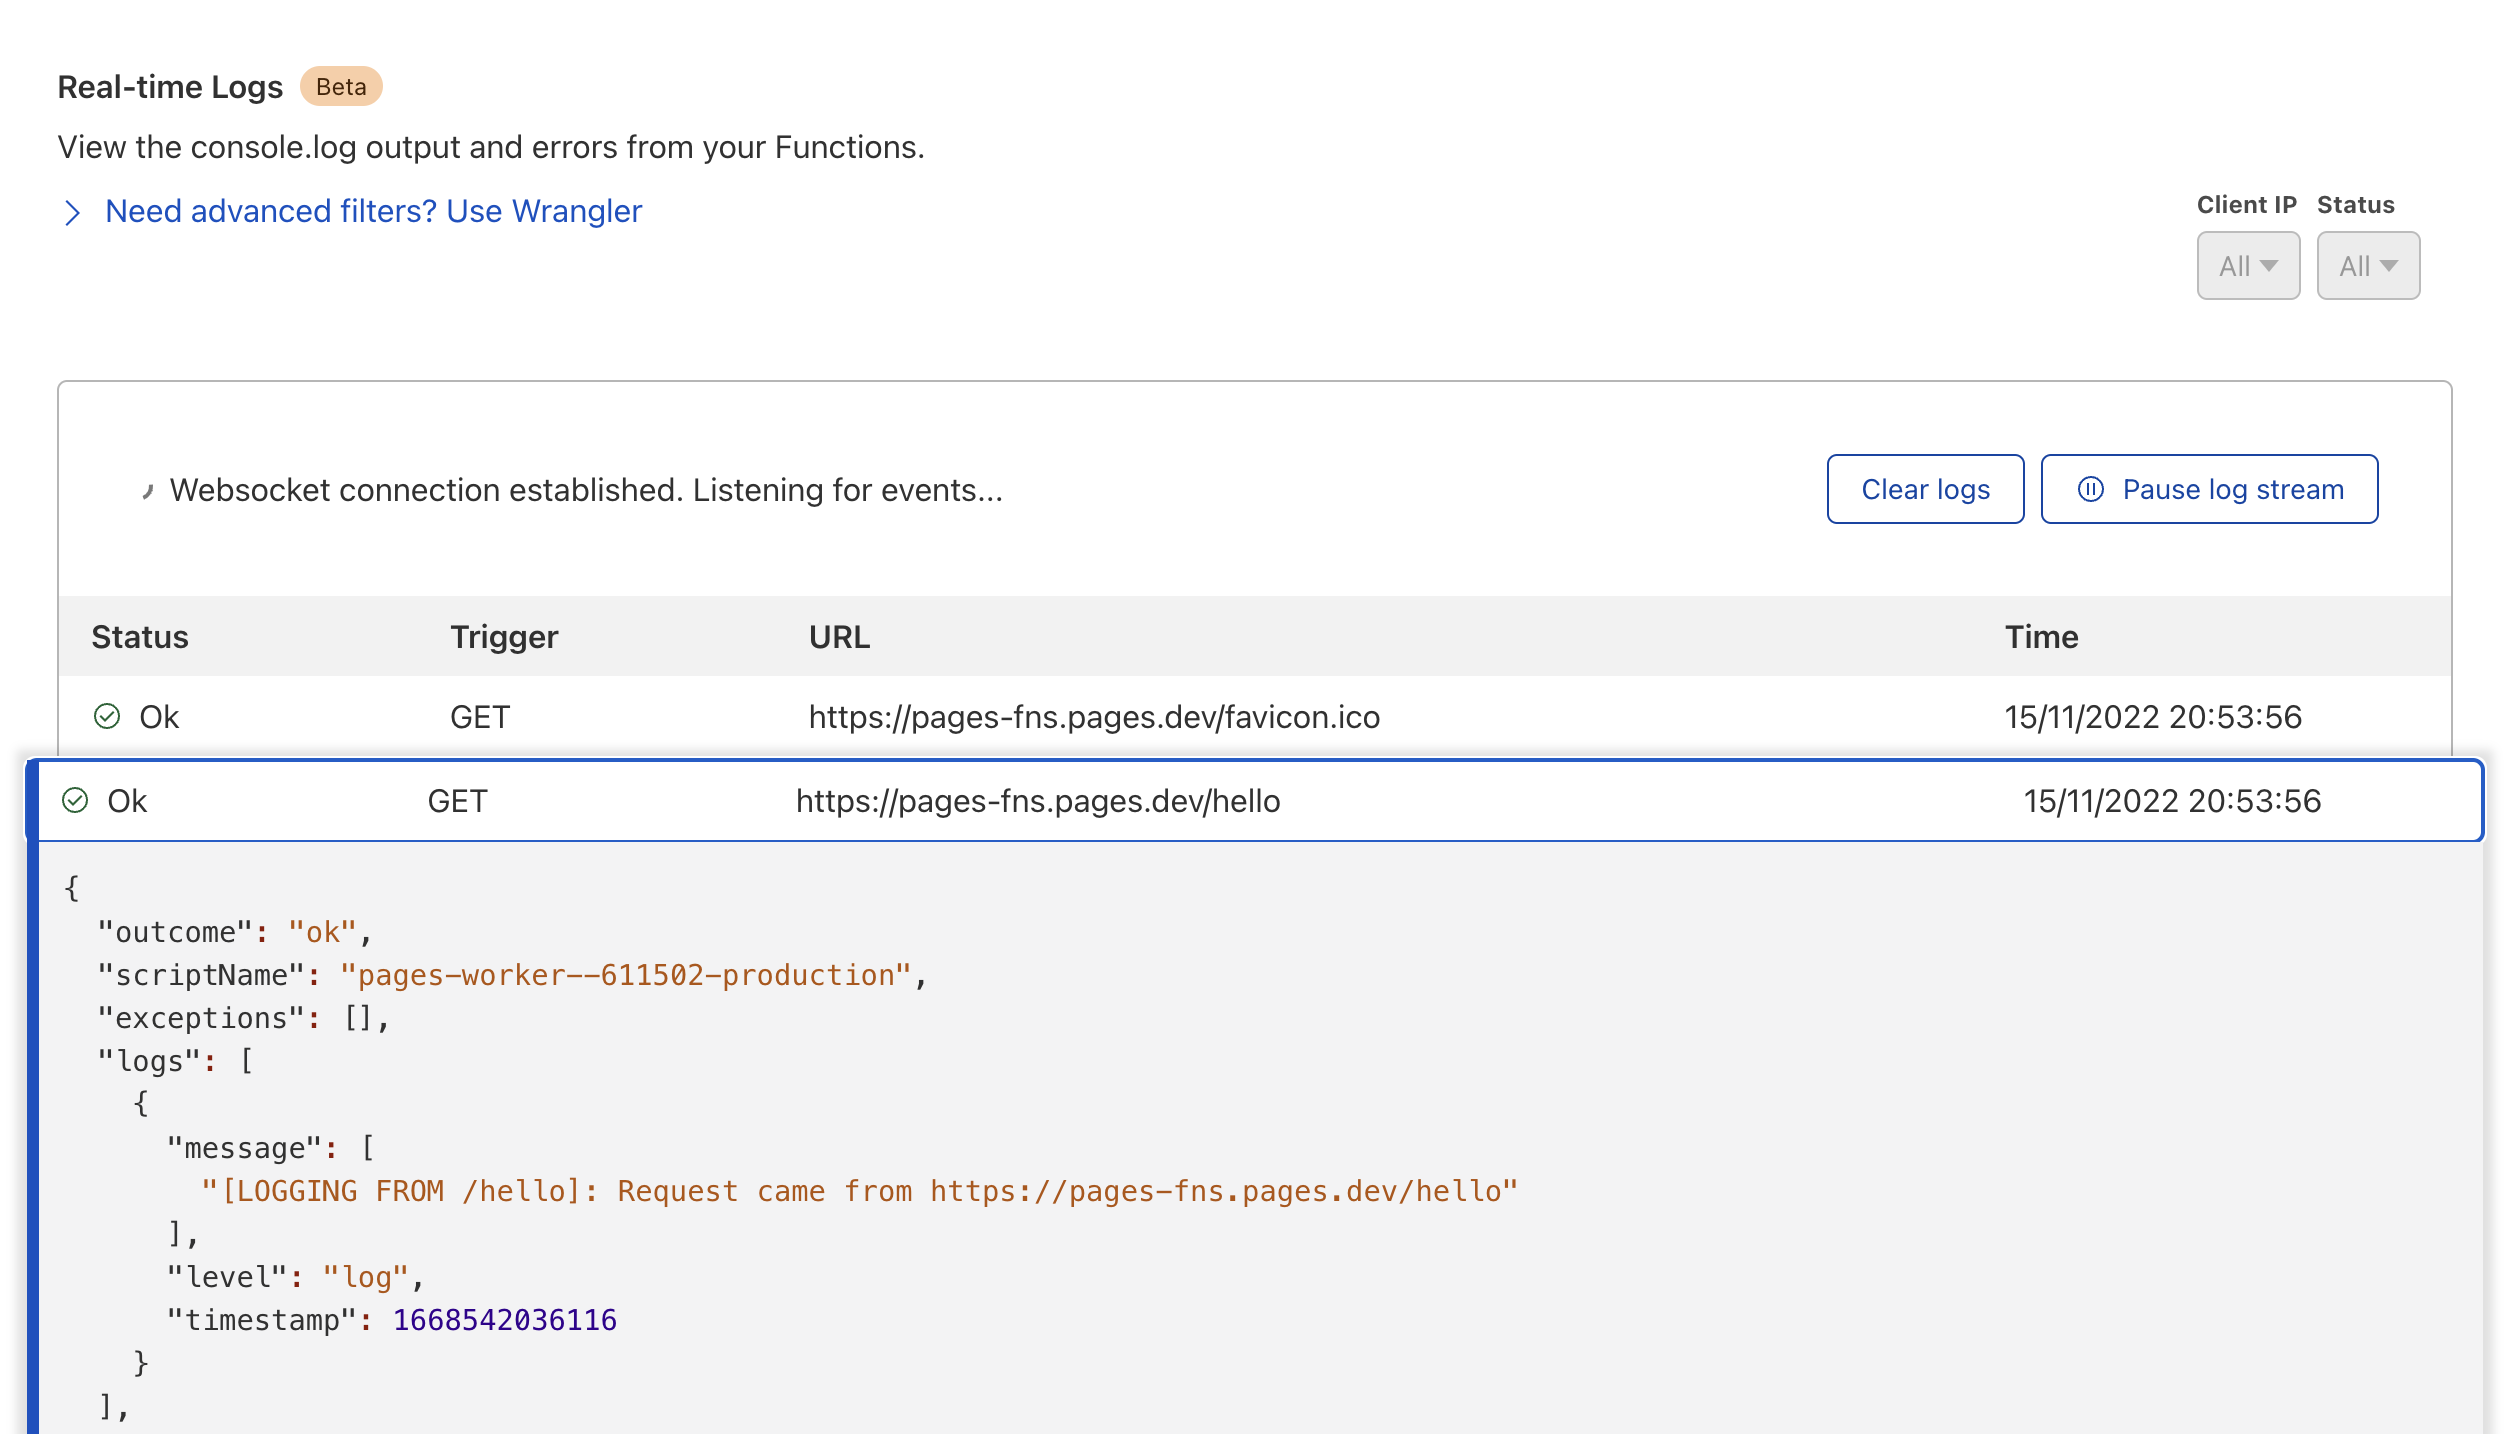
Similarly, your dashboard will display:
View logs with wrangler
Logs can be very useful in situations where users are running into production issues that cannot be easily reproduced. In such instances, wrangler pages deployment tail enables developers to livestream the logs for a specific project and deployment, and gain real-time insight into their application’s incoming requests.
To get started, run wrangler pages deployment tail in your Pages project directory. This will log any incoming requests to your application in your local terminal.
The output of each wrangler pages deployment tail log is a structured JSON object:
{  "outcome": "ok",  "scriptName": null,  "exceptions": [],  "logs": [],  "eventTimestamp": 1668542036104,  "event": {    "request": {      "url": "https://pages-fns.pages.dev",      "method": "GET",      "headers": {},      "cf": {}    },    "response": {      "status": 200    }  },  "id": 0
}
wrangler pages deployment tail gives you much more granular control over how you can customize a logging session to better suit your needs. Please refer to the wrangler pages deployment tail documentation for available configuration options
View logs in the Cloudflare Dashboard
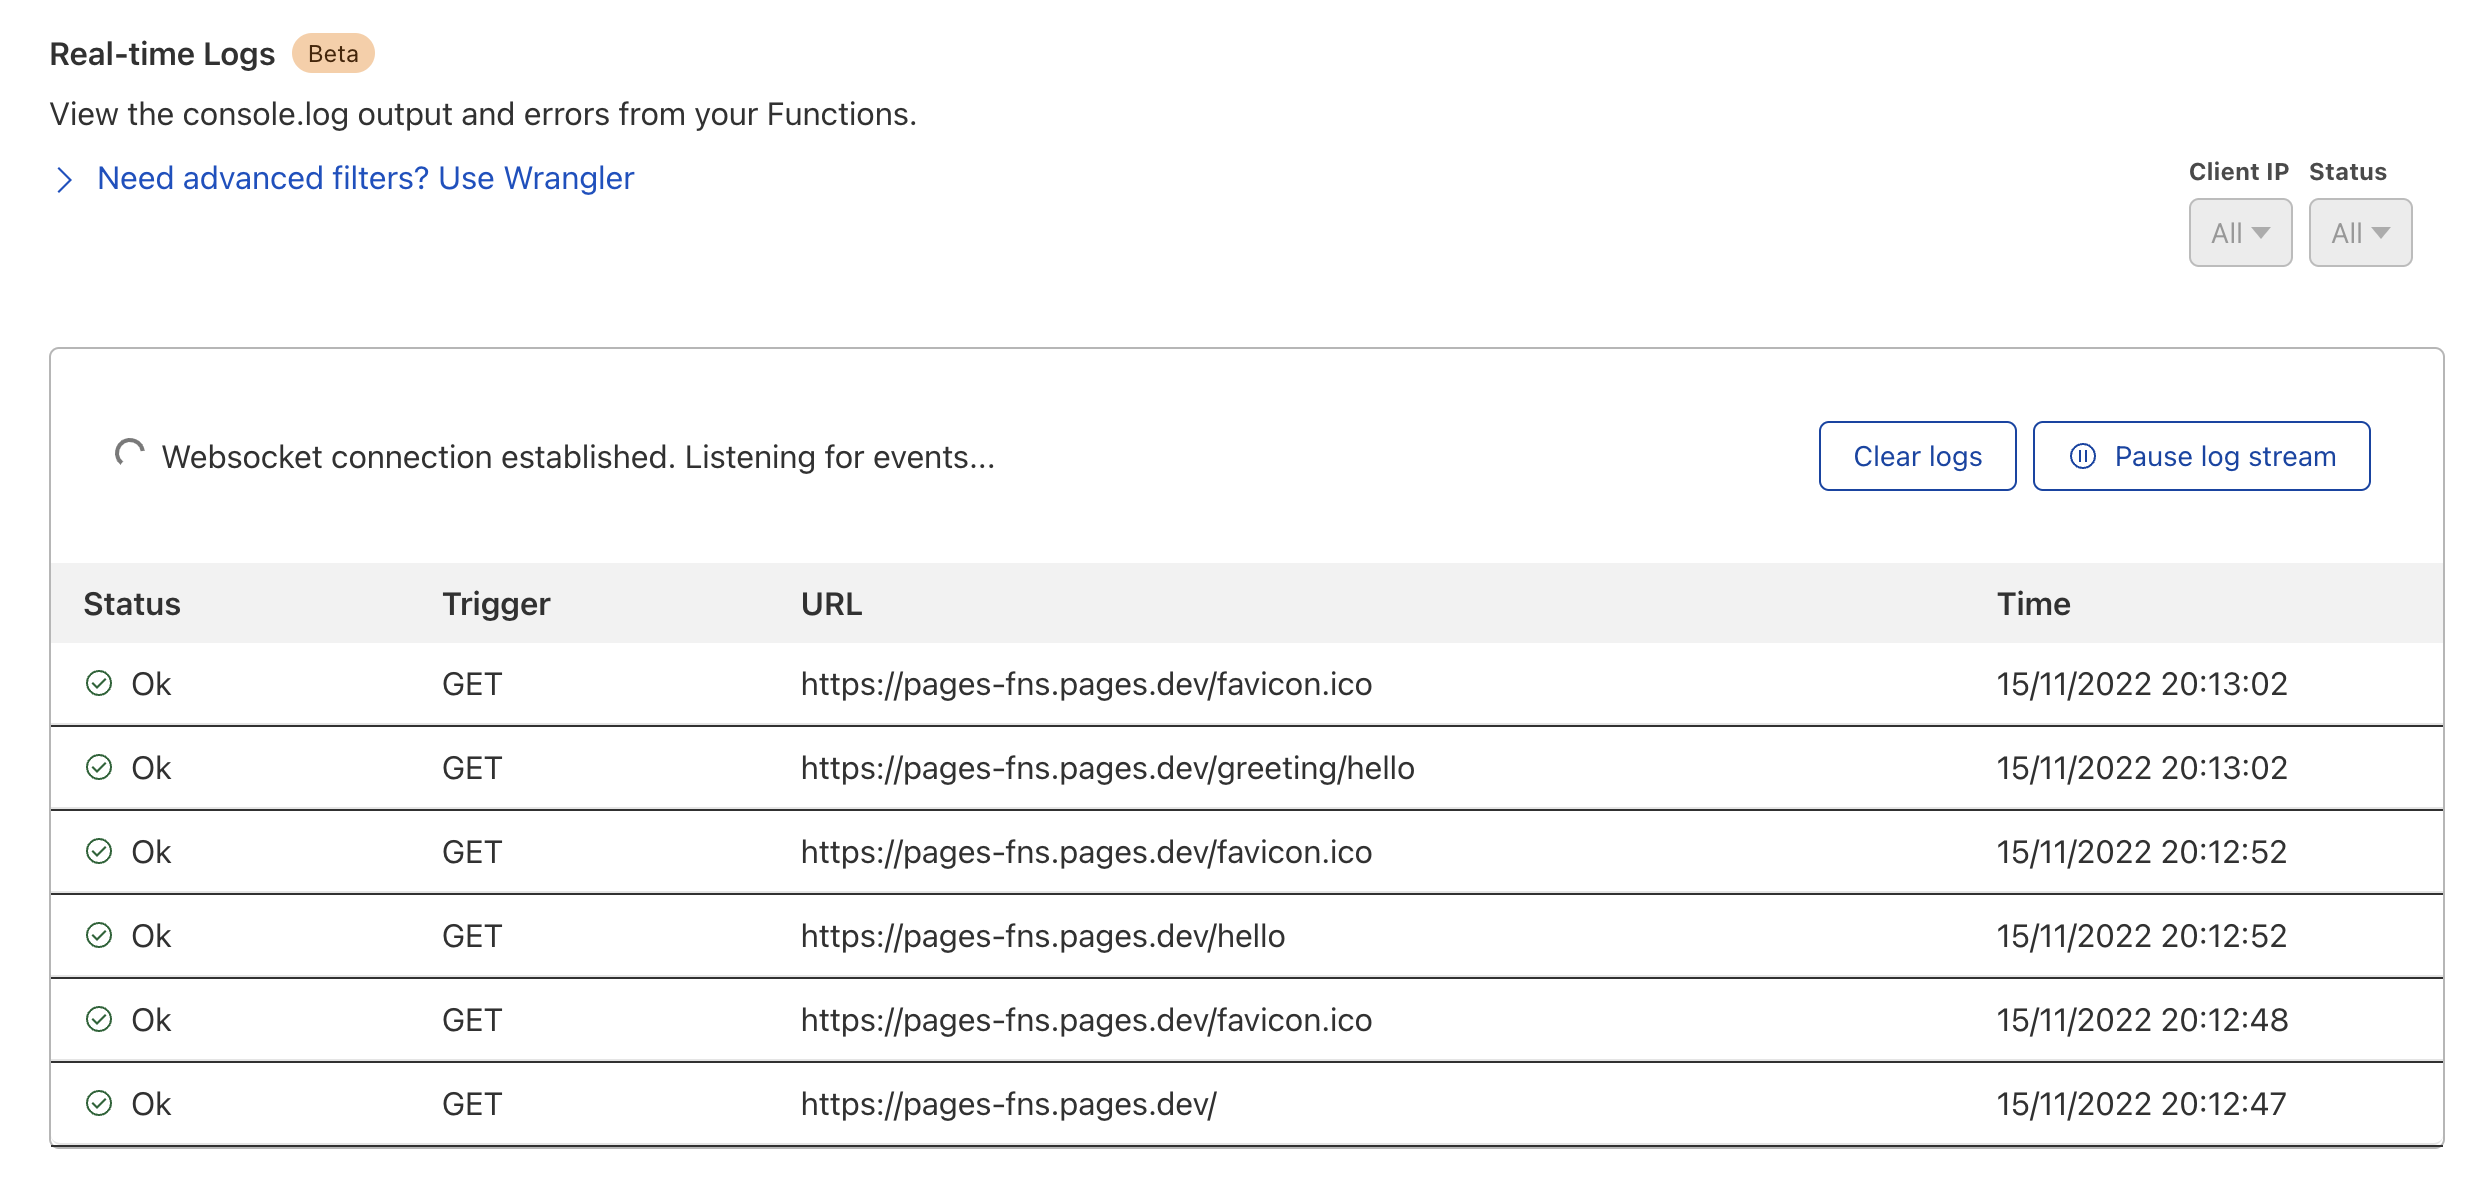
You can view logs for your production or preview environments associated with any deployment by logging in to your Cloudflare dashboard. From your
Account Home > select Pages > your Pages project > Deployment Details > Functions. Logging is available for all customers, including those on the free plan.
Note that:
- Logs are not stored. You can start and stop the stream at any time to view them, but they do not persist.
- Logs will not display if the Function’s requests per second are over 100 for the last 5 minutes.
- Logs from any Durable Objects your Functions bind to, will show up in the dashboard.
- A maximum of 10 clients can view a deployment’s logs at one time. This can be a combination of either dashboard sessions or
wrangler pages deployment tailcalls.